Ravaux, J., Bosc, O., Boinet, C., Fusari, C.-E., Lamoureux, J., Trancart, T., & de Mazancourt, V. (2025). Habitat selection and copper toxicity in the freshwater amphidromous shrimp Caridina multidentata Stimpson, 1860 (Decapoda: Caridea: Atyidae). Journal of Crustacean Biology, 45(2), 20. https://doi.org/10.1093/JCBIOL/RUAF020
Les crevettes amphidromes de la famille des Atyidae, comme Caridina multidentata Stimpson, 1860, jouent un rôle crucial dans les écosystèmes d'eau douce. Malgré leur importance écologique, notre compréhension des facteurs influençant leur distribution, leur abondance et leur comportement reste limitée. Nous visons à combler cette lacune en étudiant l'écologie sensorielle de C. multidentata, en nous concentrant sur le rôle des facteurs biotiques et abiotiques dans la sélection des microhabitats et la réponse aux facteurs de stress environnementaux tels que la pollution. Les tests de choix olfactif ont indiqué que les crevettes ne répondaient pas aux signaux chimiques des conspécifiques ou des espèces hétérospécifiques, mais qu'elles préféraient les environnements où le courant circulait et où la lumière était évitée. Elles n'ont pas montré de préférence pour une combinaison de conditions « refuge », ce qui suggère qu'elles n'ont pas perçu de menace dans le cadre expérimental et qu'elles étaient capables de se répartir en fonction de leurs conditions préférées d'obscurité ou de courant. Les tests de toxicité aiguë ont établi une concentration létale médiane (CL50) de cuivre à 1,15 mg l-1. La pré-exposition à des concentrations sublétales de cuivre a altéré la capacité des crevettes à détecter les odeurs de nourriture, suggérant des impacts potentiels sur la sélection de l'habitat et la survie. Les recherches futures devraient porter sur les effets à long terme des polluants sur le comportement et la survie des crevettes, et explorer le rôle des indices environnementaux tels que le paysage chimique de la rivière.
Contact BOREA : Juliette Ravaux, juliette.ravaux@sorbonne-universite.fr
Légende/Picture title :
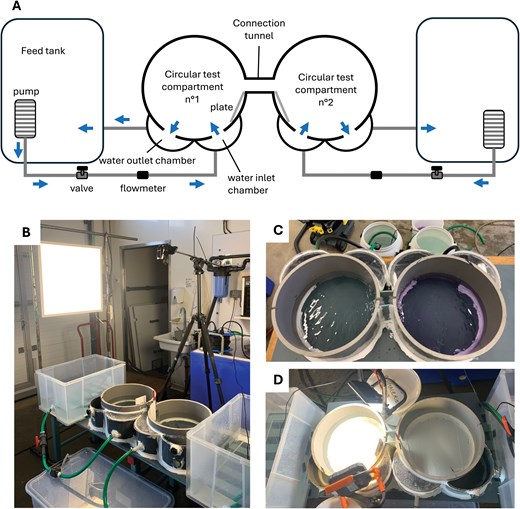
Fig.1. The system for choice experiments with Caridina multidentata consisted of two circular PVC compartments (35 cm in diameter, 20 cm high) linked by a connection tunnel (5 cm long, 5 cm wide, 20 cm high) (A, B). A feed tank equipped with a pump was connected to each of the circular compartments through a water inlet chamber, allowing for the continuous injection of water throughout the experiment at rate of 4 l min–1. The use of PVC plates next to the connection tunnel was intended to prevent the mixing of water in the tunnel and facilitate the establishment of a circular flow in the compartments. A water outlet chamber evacuated water to the feeder tank via an overflow system. The injected water rotated within each compartment, preventing any mixing between the two. A preliminary test was conducted to validate the system by injecting a blue dye solution into one of the tanks, and it was observed that there was no mixing with the other tank (C). An additional light source was added to the left-hand test compartment in a set-up for light tests (D). © Ravaux et al.
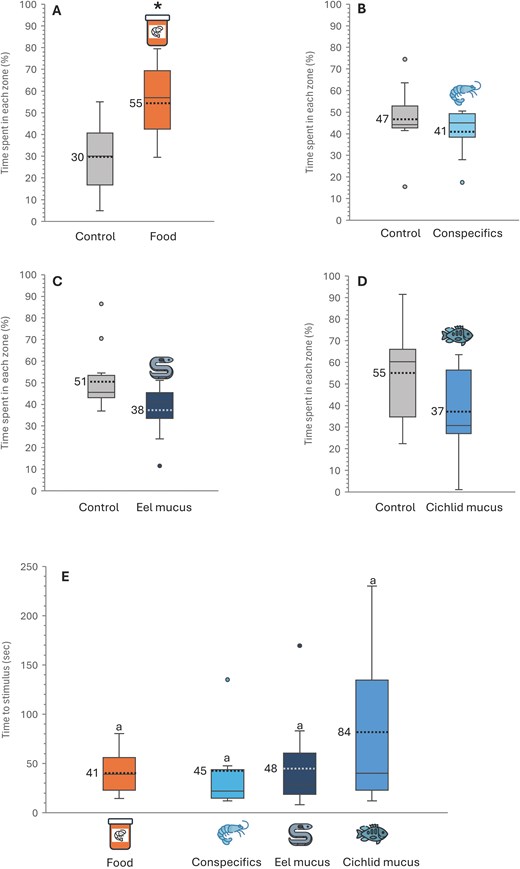
Fig. 2. Responses of Caridina multidentata to chemical stimuli in choice experiments expressed as percentage of time spent in each compartment; significant differences indicated with an asterisk (A–D). Food stimulus (artificial pellets) (A), conspecific stimulus (individuals of C. multidentata) (B), European eel Anguilla anguilla stimulus (mucus) (C) cichlid Amphilophus sp. stimulus (mucus) (D). The individual tested spent 5–10% of the time in the connecting zone between two test compartments (neutral zone, not shown). Responses expressed as time to reach the compartment containing the stimulus, values with different letters are significantly different (E). Each experiment was conducted on a sample size of ten individuals. Data are represented as box plots, with whiskers indicating the minimum and maximum, the box delimiting the first quartile and third quartile, the median identified by a continuous horizontal line and the mean identified by a dotted line (the value for the mean is shown next to the line). Extreme points are represented as circles. © Ravaux et al.
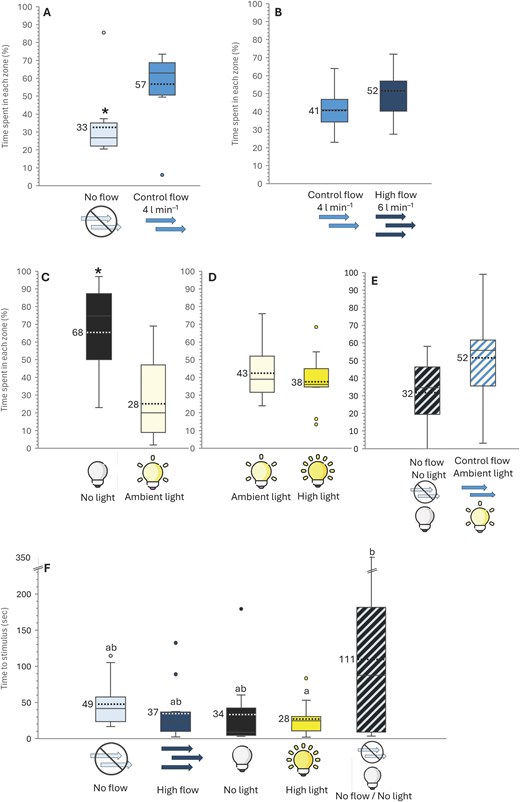
Fig. 3. Responses to abiotic stimuli in Caridina multidentata individuals expressed as percentage of time spent in each compartment; significant differences are indicated with an asterisk (A–E). No flow (0 l min–1) versus control flow (4 l min–1) (A), control flow (4 l min–1) versus high flow (6 l min–1) (B), no light versus ambient light (50 lux) (C), ambient light (50 lux) versus high light (750 lux) (D) no flow and no light versus control flow (4 l min–1) and ambient light (50 lux) (E). The individuals tested spent 4 –11% of the time in the connecting zone between the two test compartments (neutral zone, not shown). Responses expressed as time to reach the compartment containing the stimulus, values with different letters are significantly different (F). Each experiment was conducted on a sample size of ten individuals. Data are represented as box plots, with whiskers indicating the minimum and maximum, the box delimiting the first quartile and third quartile, the median identified by a continuous horizontal line and the mean identified by a dotted line (the value for the mean is shown next to the line). Extreme points are represented as circles. © Ravaux et al.
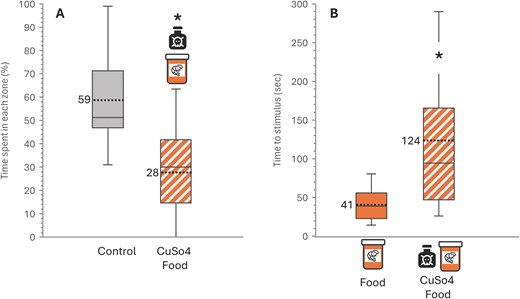
Fig. 5. Responses of individuals of Caridina multidentata to food stimulus after pre-exposure to a pollutant (CuSO4) in choice experiments expressed as percentage of time spent in the control compartment and in the compartment with the food stimulus after pre-exposure to copper (CuSO4 + food) (A). The mean time spent by individuals in the connecting zone between the two test compartments was 13% (neutral zone, not shown). Responses expressed as time to reach the compartment containing the food for non-tested (food) and copper-tested (CuSO4 + food) shrimp (B). Data are represented as box plots, with whiskers indicating the minimum and maximum, the box delimiting the first quartile and third quartile, the median identified by a continuous horizontal line and the mean identified by a dotted line (the value for the mean is shown next to the line). Significant differences are indicated with an asterisk. © Ravaux et al.