The epitome of data paucity : Deep-sea habitats of the Southern Indian Ocean
The epitome of data paucity : Deep-sea habitats of the Southern Indian Ocean
Ramiro-Sánchez, B., Martin, A., & Leroy, B. (2023). The epitome of data paucity: Deep-sea habitats of the Southern Indian Ocean. Biological Conservation, 283, 110096.
In the deep seafloor, corals, sponges, and other groups of animals provide a home for various organisms, including commercial fisheries. But deep-sea bottom-trawling, intensified by climate change, endangers the recovery of these slow-growing, long-lived, late-maturing species. Indeed, many deep-sea species and habitats hold international conservation value. Collectively known as Vulnerable Marine Ecosystem indicators, UN resolutions mandate conservation measures for their protection. In the high seas, such measures are developed by Regional Fishery Management Organizations.
The development of conservation measures should be driven by biodiversity maps. Biodiversity maps enable the analysis and identification of bioregions, which are regions with species groups that have a common history, environmental, and biological characteristics. Understanding whether species are organized into bioregions is a key step in developing conservation measures, as it allows the management of multiple species at a time. Moreover, it facilitates biodiversity maintenance by identifying representative and multiple areas from each bioregion.
We investigated the biodiversity of Vulnerable Marine Ecosystems in the Southern Indian Ocean, where the Southern Indian Ocean Fisheries Agreement (SIOFA) is responsible for the fisheries management plans in the high seas. Established in 2016, SIOFA has since made some progress towards protection of Vulnerable Marine Ecosystems. However, their vast management area, with complex ocean currents and depths, and a concentrated bottom-fishing, presents a challenge for developing measures. Hence, we compiled all data on the biodiversity of Vulnerable Marine Ecosystems in the Southern Indian Ocean to map bioregions that may inform SIOFA's plans.
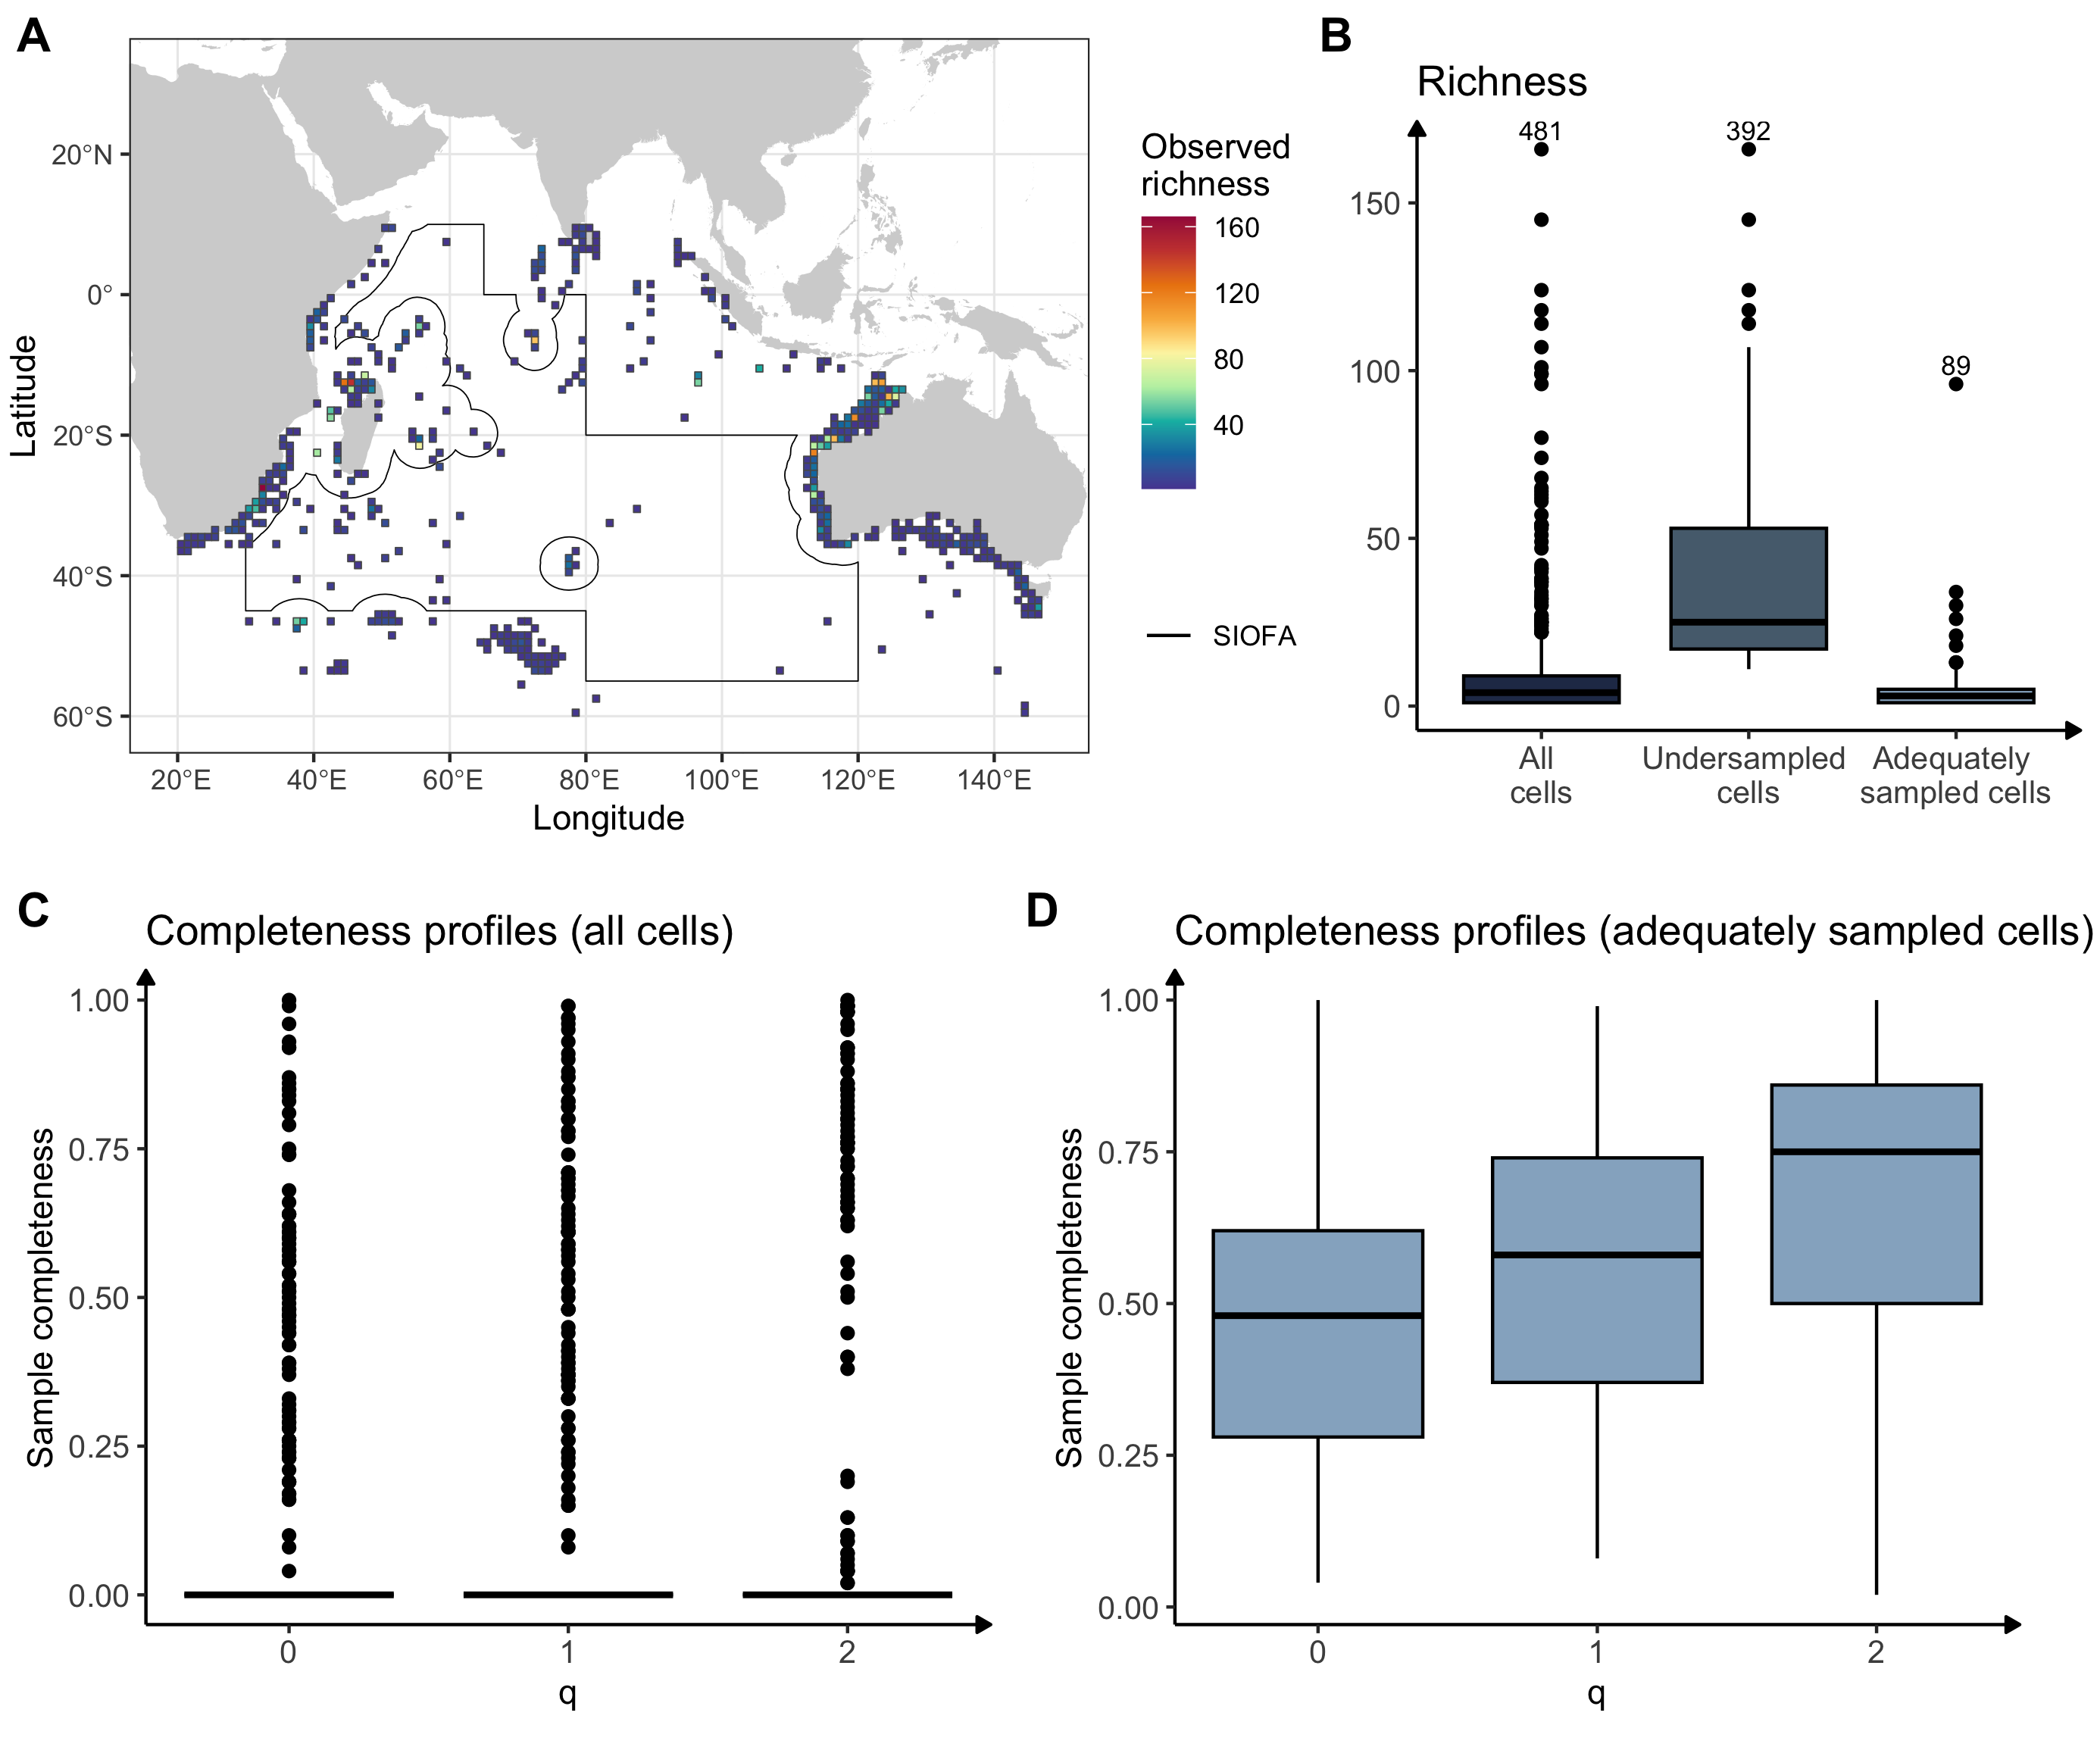
However, our results indicated that the high seas of the Southern Indian Ocean are critically undersampled, with the deep-sea biodiversity inventory being especially incomplete. Despite this, we were able to map eight different bioregions across the Southern Indian Ocean, although their full extent and composition remains to be explored due to data scarcity. Our findings emphasize SIOFA's responsibility to protect biodiversity using a precautionary approach. Critically, they underscore our global collective responsibility to invest in biodiversity inventories for the deep sea, to address the severe knowledge shortfalls that hinder our capacity to protect biodiversity.
BOREA Contact : Berta Ramiro Sánchez
Picture Titles :
Fig. 1 (illustration de couverture) (A) Distribution of observed richness in the study area at 1° latitude-longitude spatial resolution. The black polygon represents SIOFA's management area. (B) Observed richness calculated over different subsets of our data at 1° spatial resolution. (C) Sample completeness profiles calculated for all cells, and (D) Sample completeness profiles calculated for adequately sampled cells only, for all diversity orders at 1° spatial resolution. Undersampled cells are cells that had ≤10 species, only singletons, or <3 sampled sub-cells. Numbers over the boxplots indicate sample size (i.e., number of cells).
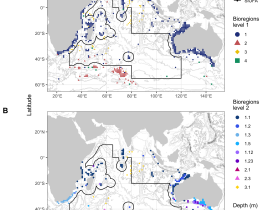
Fig. 2 (ci-dessous) Distribution of bioregions (A) and subregions (B) at 1° spatial resolution. There are four bioregions at a first level: an inshore (1), an offshore (3), a Southern Ocean (2) and a sparse (4) bioregion. At a second level, there are six subregions nested within bioregion 1 (prefix 1), two subregions in the Southern Ocean bioregion (prefix 2) and one in the offshore bioregion (prefix 3). The black polygon denotes SIOFA's management area. Bathymetric contours (every 1000 m) are shown for reference.


