Evaluating the effectiveness of management measures on skates in a changing world. Elliott, S.A.M., Bearup, D., Carpentier, A., Larivain, A., Trancart, T., Feunteun, E. 2020. Biological Conservation. 248, 108684. https://doi.org/10.1016/j.biocon.2020.108684
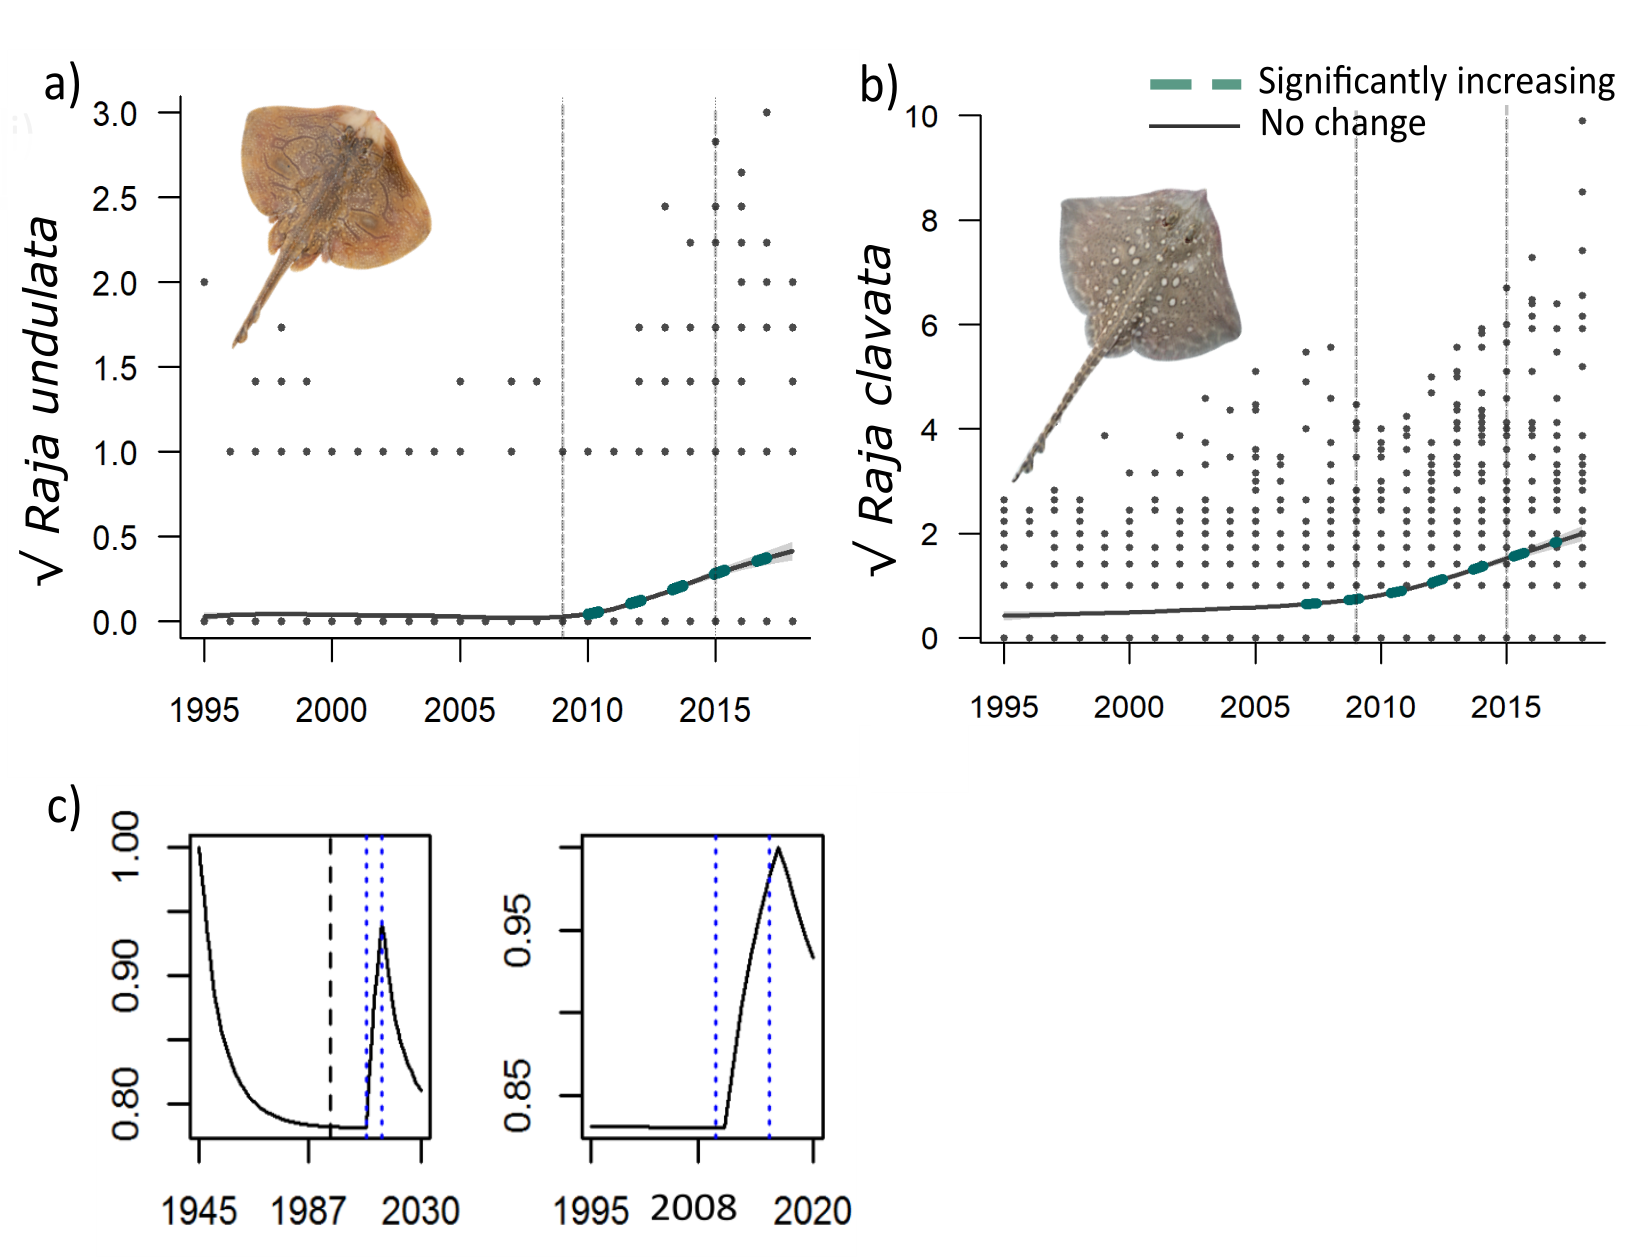
Global declines in elasmobranchs have been observed. Conservation measures such as area closures and fisheries prohibitions have been put in place to support the recovery of vulnerable species. However, the effectiveness of such measures is rarely evaluated in the context of other factors that may affect population abundance. This study investigates the effectiveness of management measures using 1) General additive mixed model derivative changes, taking into account environmental factors that may affect population stochasticity and 2) an age- structured density dependent population dynamic model. The Raja undulata (undulate ray) 2009 targeted fisheries prohibition was used as a case study. Potential beneficial responses on sympatric species Raja clavata (thornback ray) were modelled.
A significant increase in abundance was observed in both IUCN red list species during the ban. Surface seawater temperature had a marginal effect on the abundance of both species. The prohibition was in place for an insufficient length of time for long lasting effects to be detected on skate length. The population dynamic model indicated that the increase in abundance was only possible when combining the fisheries ban with in- creased juvenile discard survival. Our results indicate that species conservation measures may not only have positive effects on the species in question, but also on species with a niche overlap. Nonetheless, due to ongoing fishing for other species, the full potential of fisheries prohibitions may not be realised. For real benefits to be assessed, evaluation of bans should take place once a steady state is observed.
Legend:The square root mean number of a) Raja undulata b) Raja clavata per haul, from 1995 to 2018 using Channel Ground Fish Survey data. The vertical dashed black line indicates the 2009 R. undulata ban and the 2015 relax in prohibition. c) R. undulata population dynamic results from the Leslie matrix model. The vertical black dashed line indicates 1995, when CGFS data analysis began. Two figures for c) are plotted to understand temporal trends at the different scales (1945–2030 and 1995–2018).
BOREA contact: Sophie Elliott, sophie.elliott@agrocampus-ouest.fr


